Loading…
I am an AI, Full-Stack, and Data Analyst professional focused on building smart, data-driven solutions. I work with machine learning, software development, and data analytics to turn data into useful insights and practical applications. I enjoy solving real-world problems and building end-to-end solutions from data processing to deployment and visualization.
Secure payment via PayPal
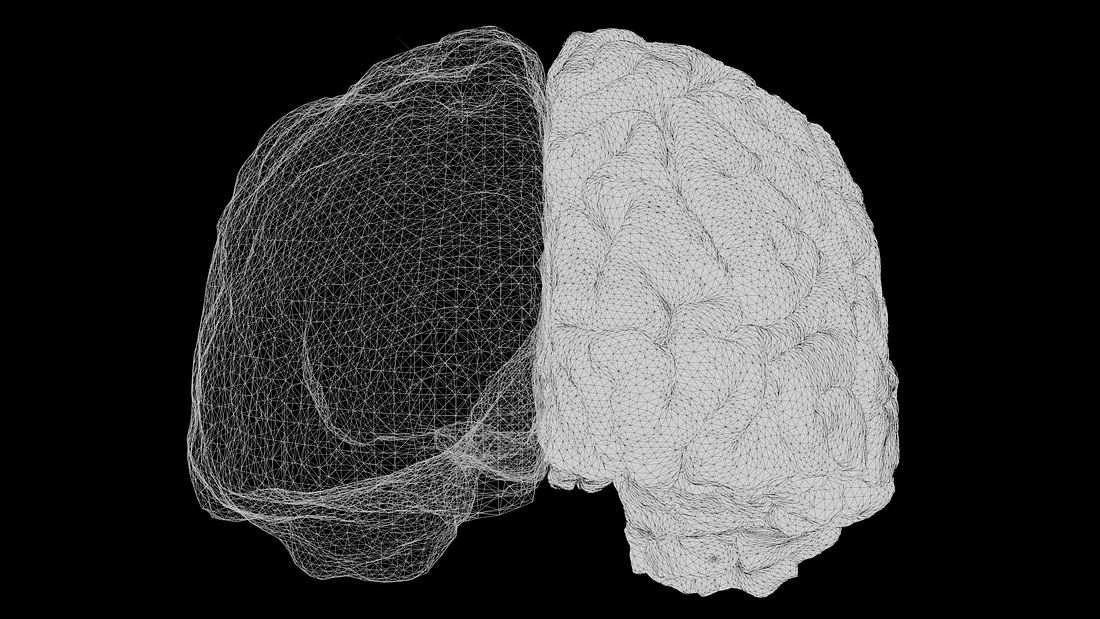
Longitudinal brain-MRI disease-evolution platform. Tracks how tumour findings change across serial studies: 3D SegResNet segmentation (0.92 Dice whole tumour, held-out BraTS), registration, cross-time lesion matching, change detection with propagated uncertainty, evidence-linked 3D timeline. Every answer traces to a measurement. Research prototype.
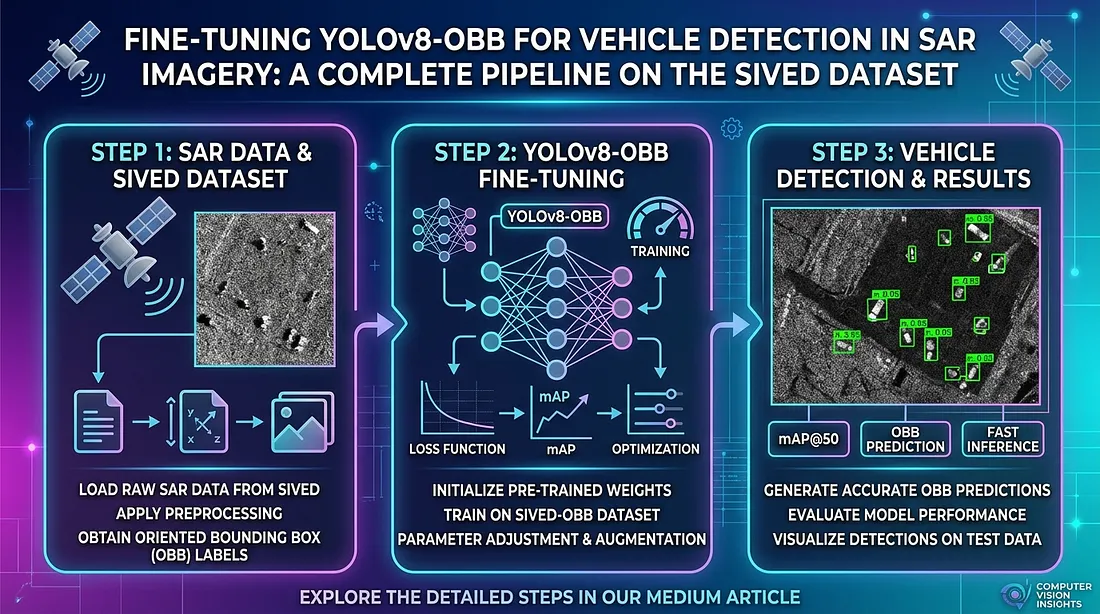
End-to-end, reproducible pipeline for fine-tuning YOLOv8-OBB on SAR imagery, including dataset extraction and validation, exploratory data analysis, annotation cleaning, DOTA-to-YOLO OBB conversion, optimized training, rigorous evaluation, and interactive Gradio deployment for accurate oriented vehicle detection on SIVED.
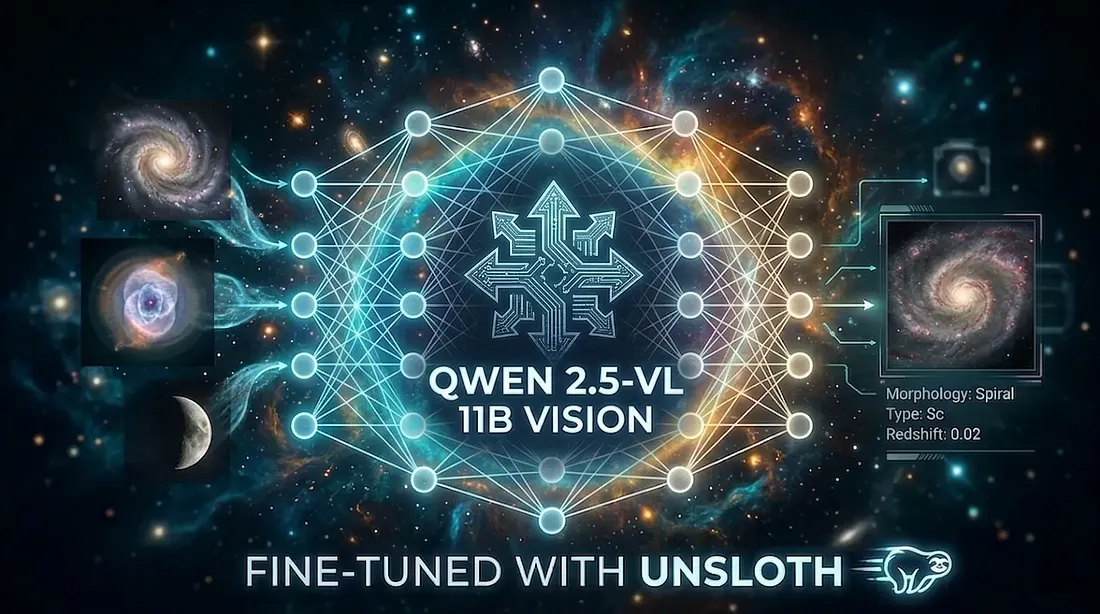
A lightweight end-to-end pipeline that fine-tunes Qwen2.5-VL-7B using LoRA adapters on an astronomy image-caption dataset, then deploys the adapted model via a Gradio interface, all with minimal GPU memory using 4-bit quantization.

TerraExplorer. A modern single-page web app that randomly explores countries, showing key info like flag, population, and region, along with AI-generated fun facts and dishes. Includes map view, history tracking, dark mode, and smooth animations, built with vanilla JavaScript and integrated with Google Gemini AI.
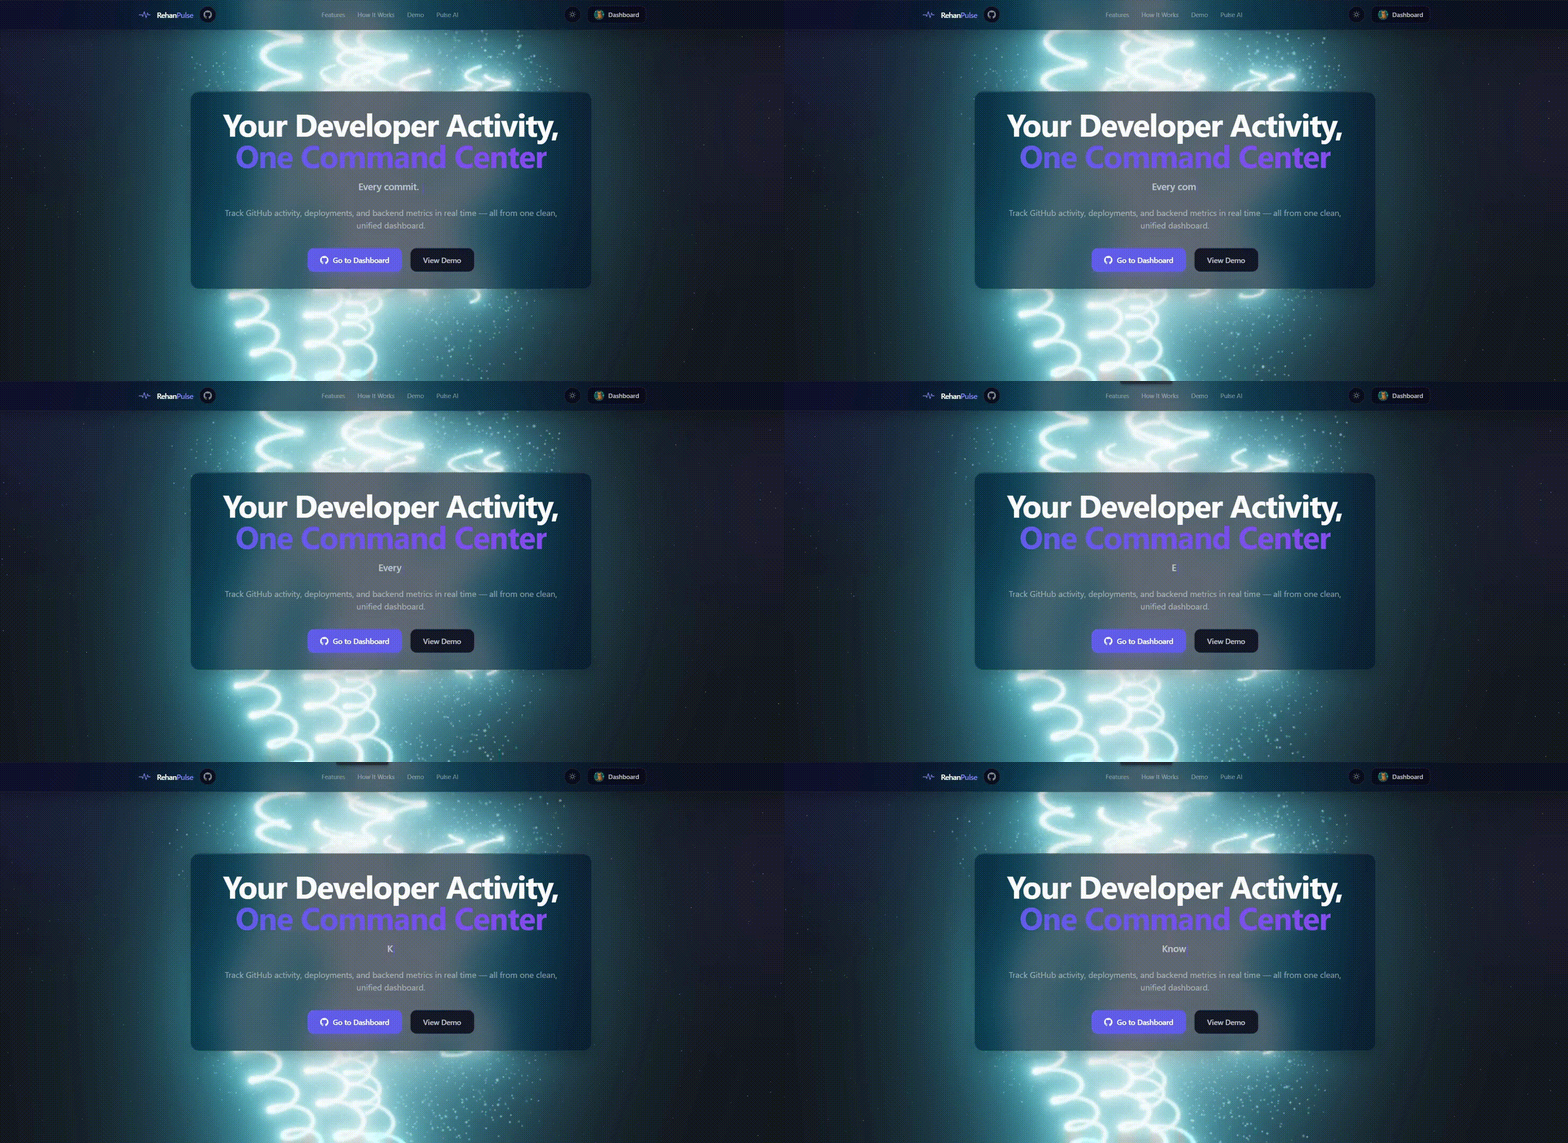
RehanPulse – A real-time developer dashboard that unifies GitHub activity, Vercel deployments, and Firebase project data into a single live-updating interface with alerts and a customizable experience, powered by an integrated LLM named “Pulse AI” to assist users with insights, automation, and intelligent support.
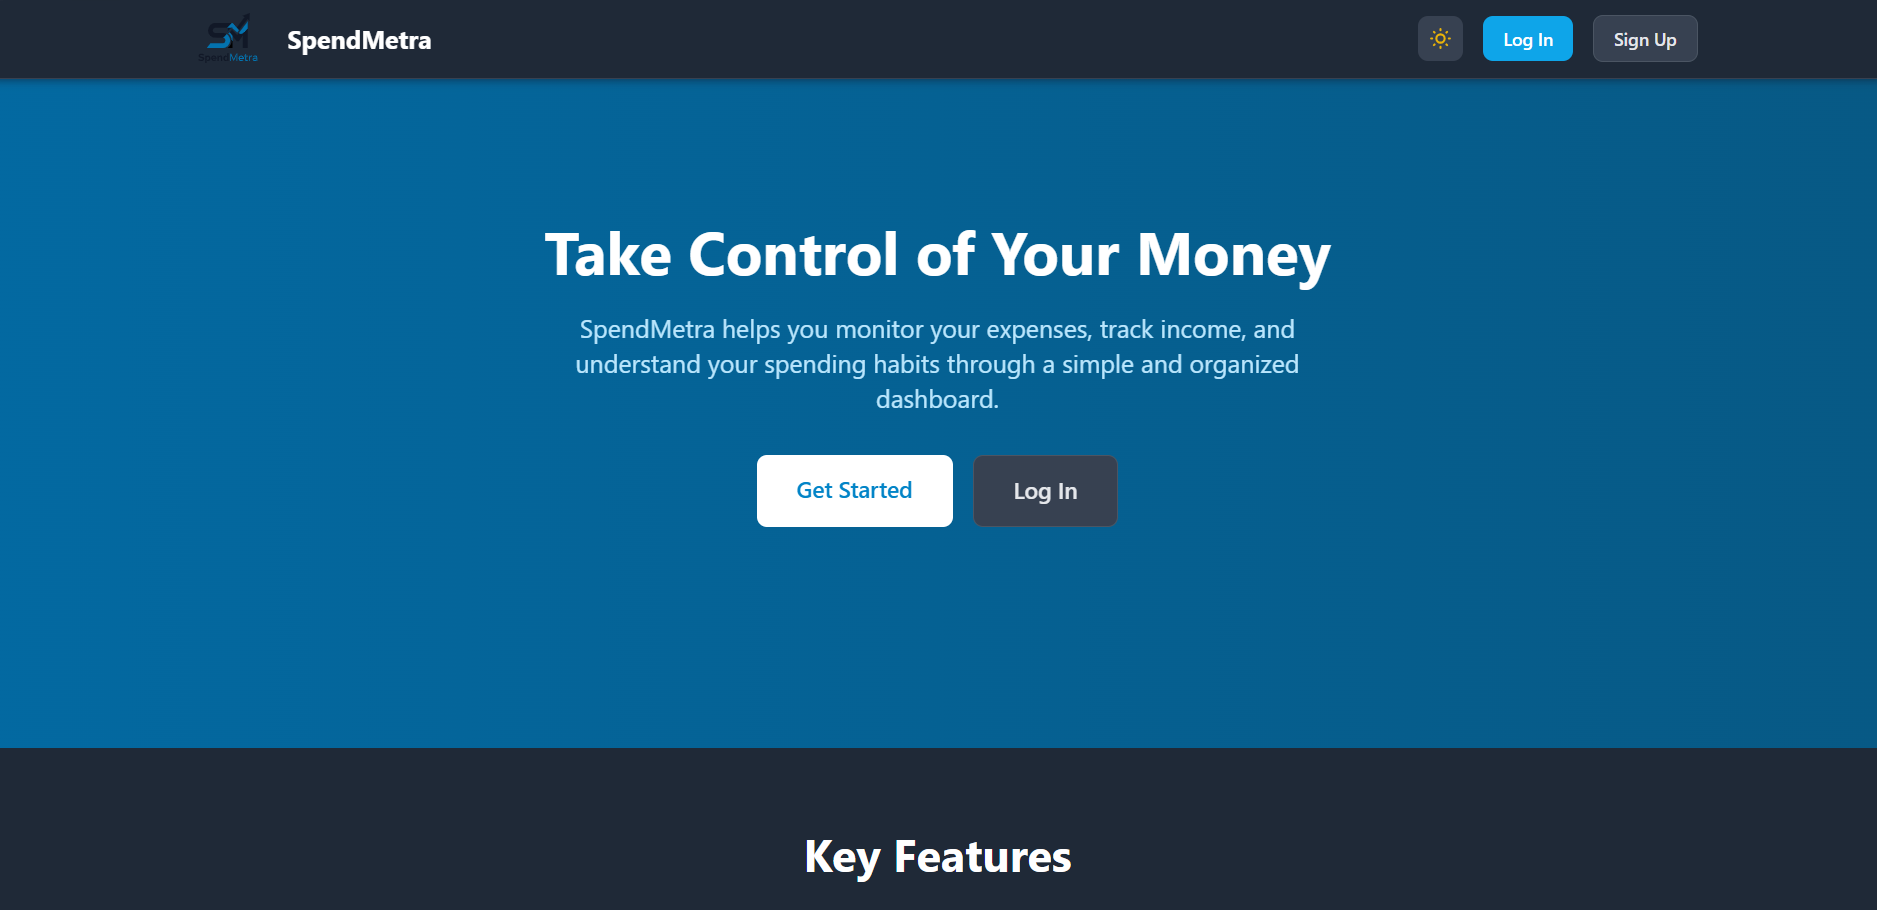
SpendMentra is a modern web app for managing personal finances. It lets users track income and expenses, categorize transactions, set financial goals, and view detailed reports. Built with React, Tailwind CSS, and Firebase, it offers secure authentication, real-time data storage, and a responsive design.
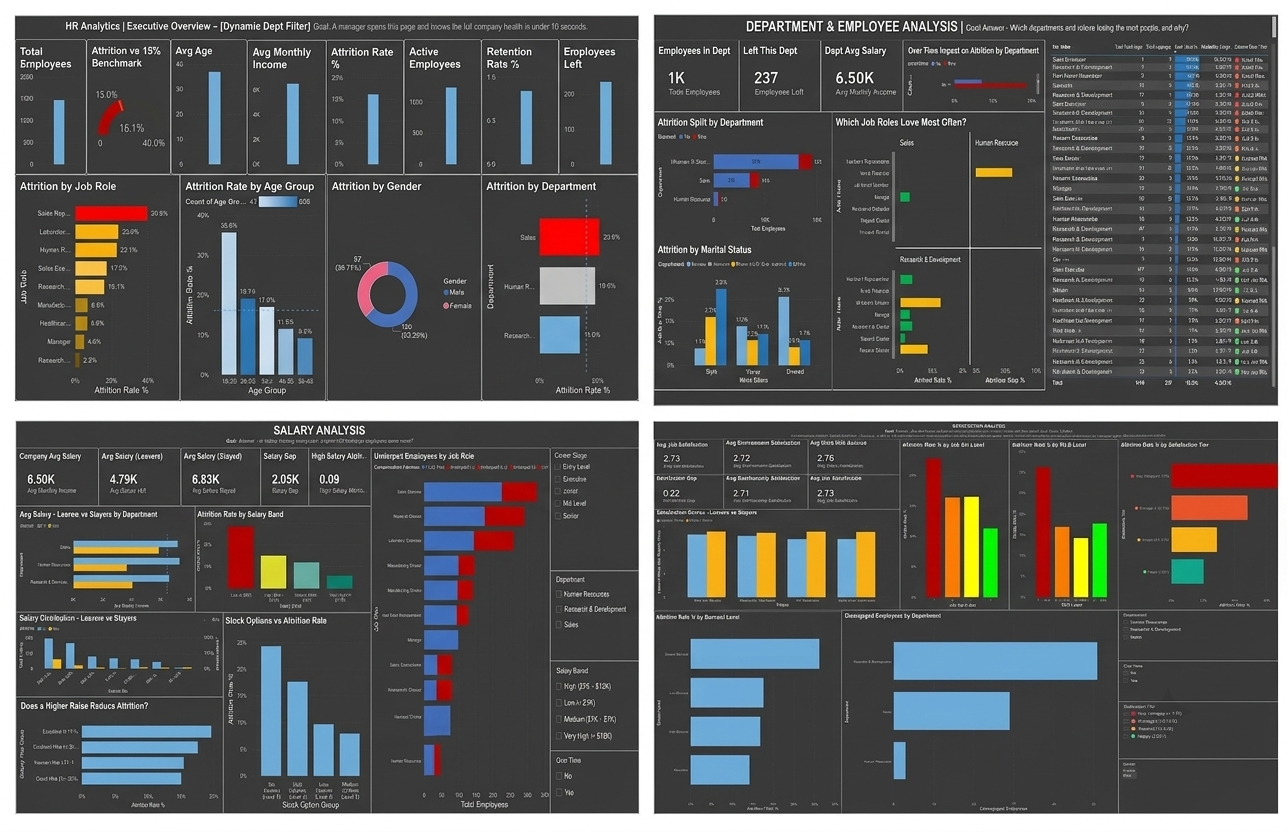
Power BI HR Analytics Dashboard built on the IBM Employee Attrition dataset (1,470 employees). Features 4 interactive dashboard pages, 50 DAX measures, 28 calculated columns, KPI tracking, salary analysis, satisfaction analysis, attrition risk scoring, and workforce insights to identify employee turnover drivers.
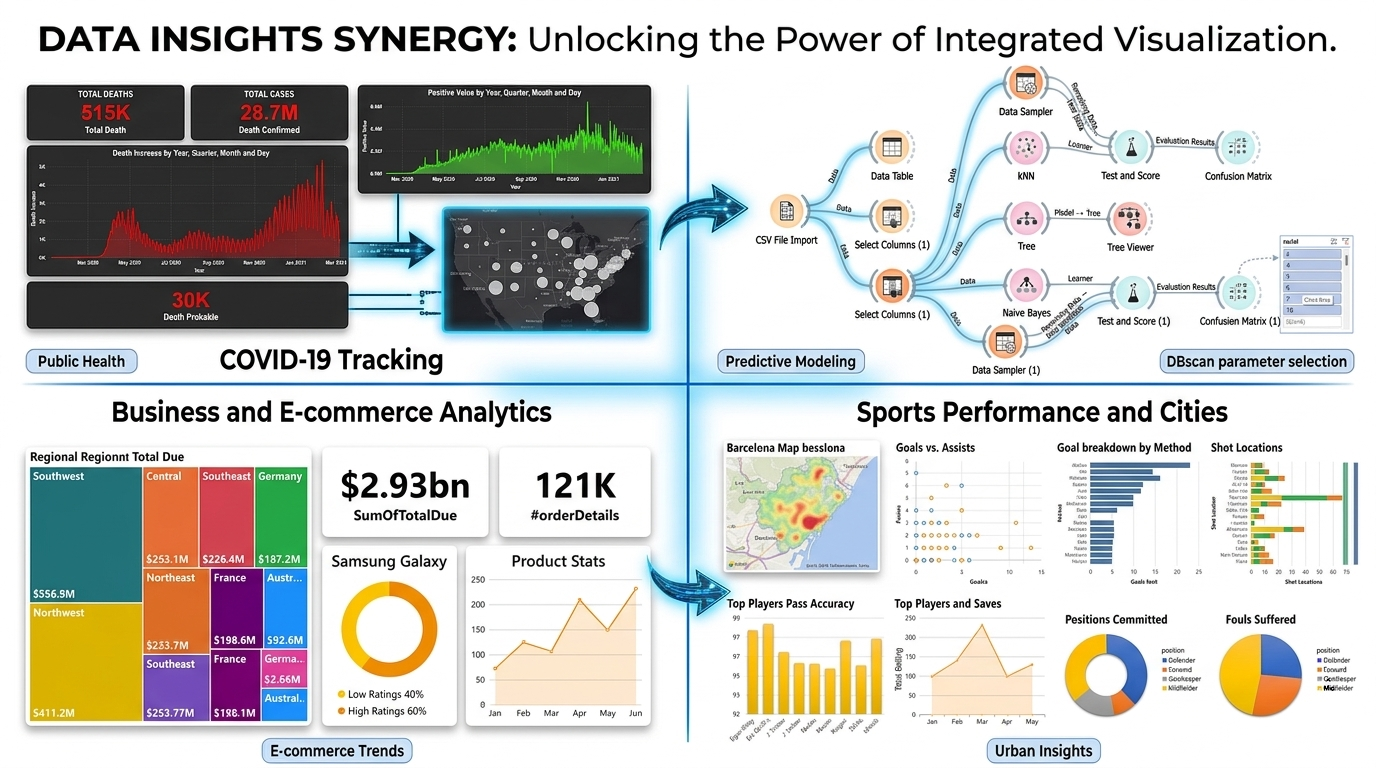
Omar Rehan’s Data Analysis Portfolio includes projects in Excel, Power BI, Tableau, Orange, and MongoDB covering data cleaning, visualization, dashboards, and machine learning (classification and clustering), plus e-commerce NoSQL design and analytics across sports, health, and city datasets with strong ML and visualization focus.
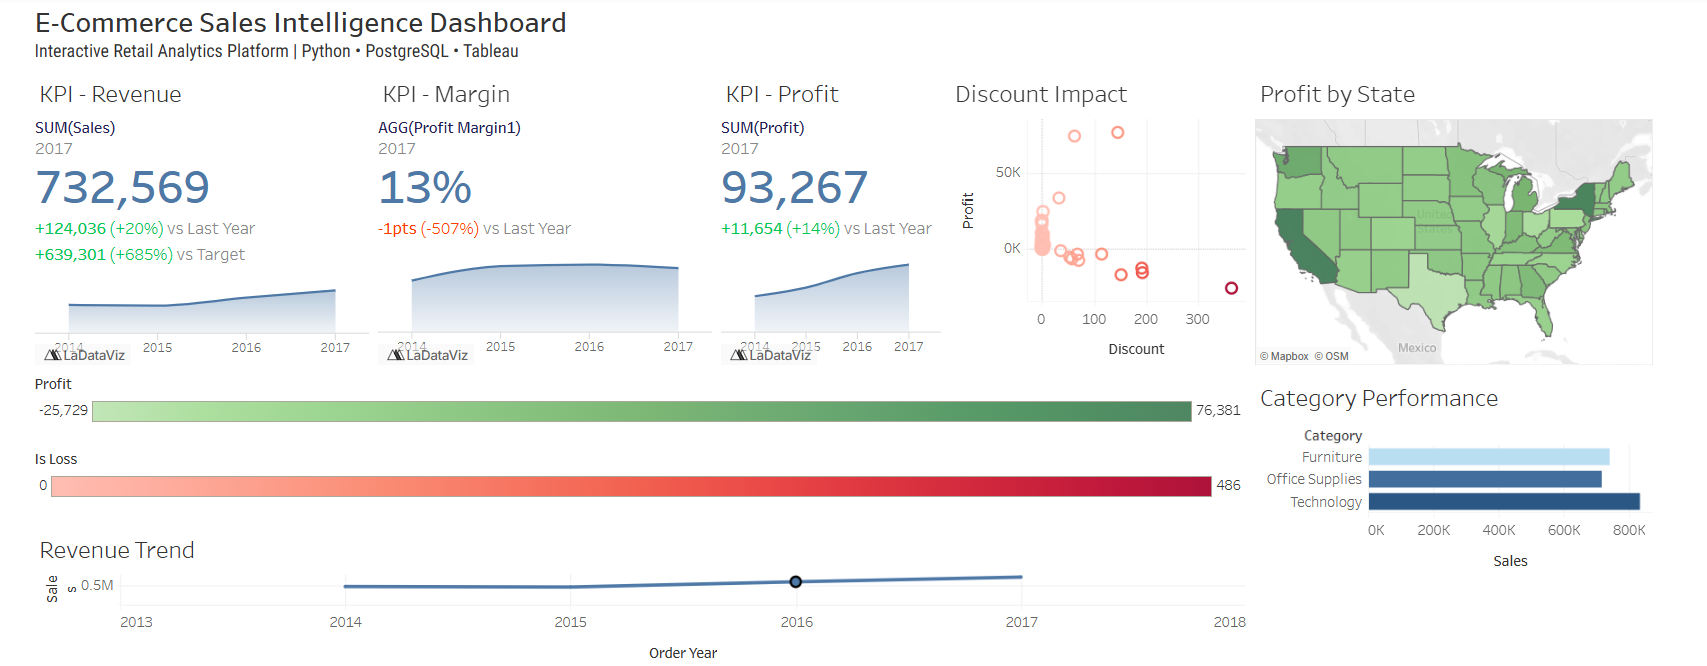
Designed and built an end-to-end retail analytics pipeline that transforms 10,000+ raw sales transactions into executive-ready insights. Leveraged Python, PostgreSQL, SQL, Machine Learning, Streamlit, Plotly, and Power BI to implement data ingestion, cleaning, warehousing, forecasting, customer segmentation, and interactive dashboards, enabling data-driven business decision-making.
Ajman, UAE
Developed and delivered multiple academic and personal projects in AI, Machine Learning, Computer Vision, Full-Stack Development, and Software Engineering, applying end-to-end development practices from design and implementation to deployment and optimization.
North Sinai, Egypt
Electronic Warfare Department – Egyptian Armed Forces
Alexandria, Egypt
Designed and developed an intelligent smart classroom system integrating AI, IoT, and embedded systems for real-time environment monitoring and automated device control.
Arab Academy for Science, Technology & Maritime Transport (AASTMT)
Digital Hub
Digital Hub
CISCO
HRDC (Cairo)
Cairo Impact Summit
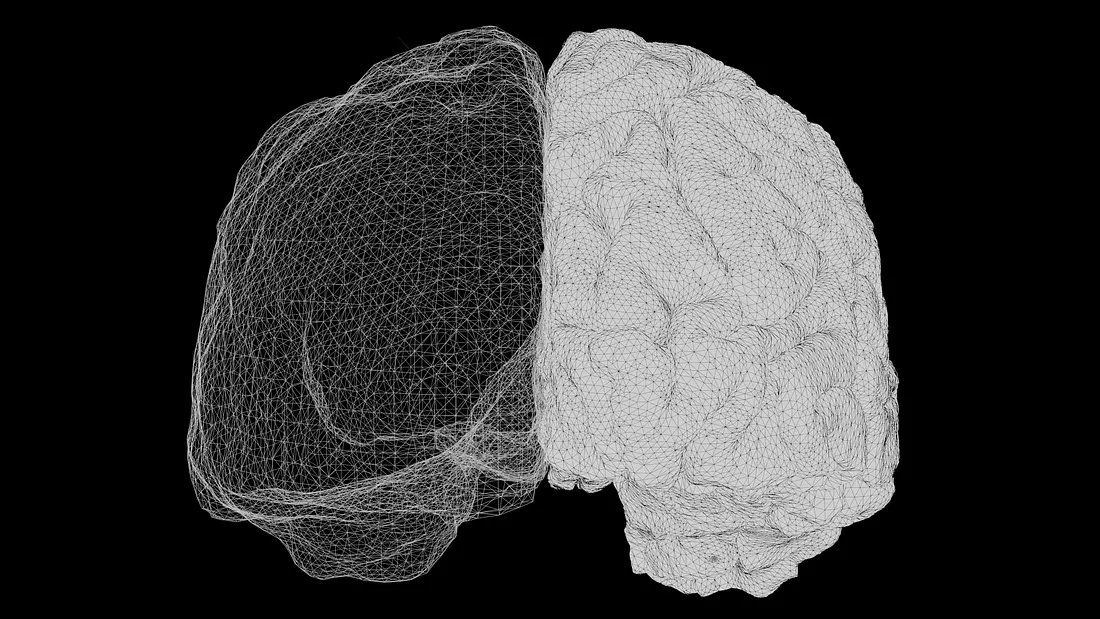
MEDTRACE is an AI workstation for tracking glioblastoma tumor growth over time. It compares sequential brain MRI scans to automatically measure volume changes, map disease trajectories, and highlight new or shrinking lesions.
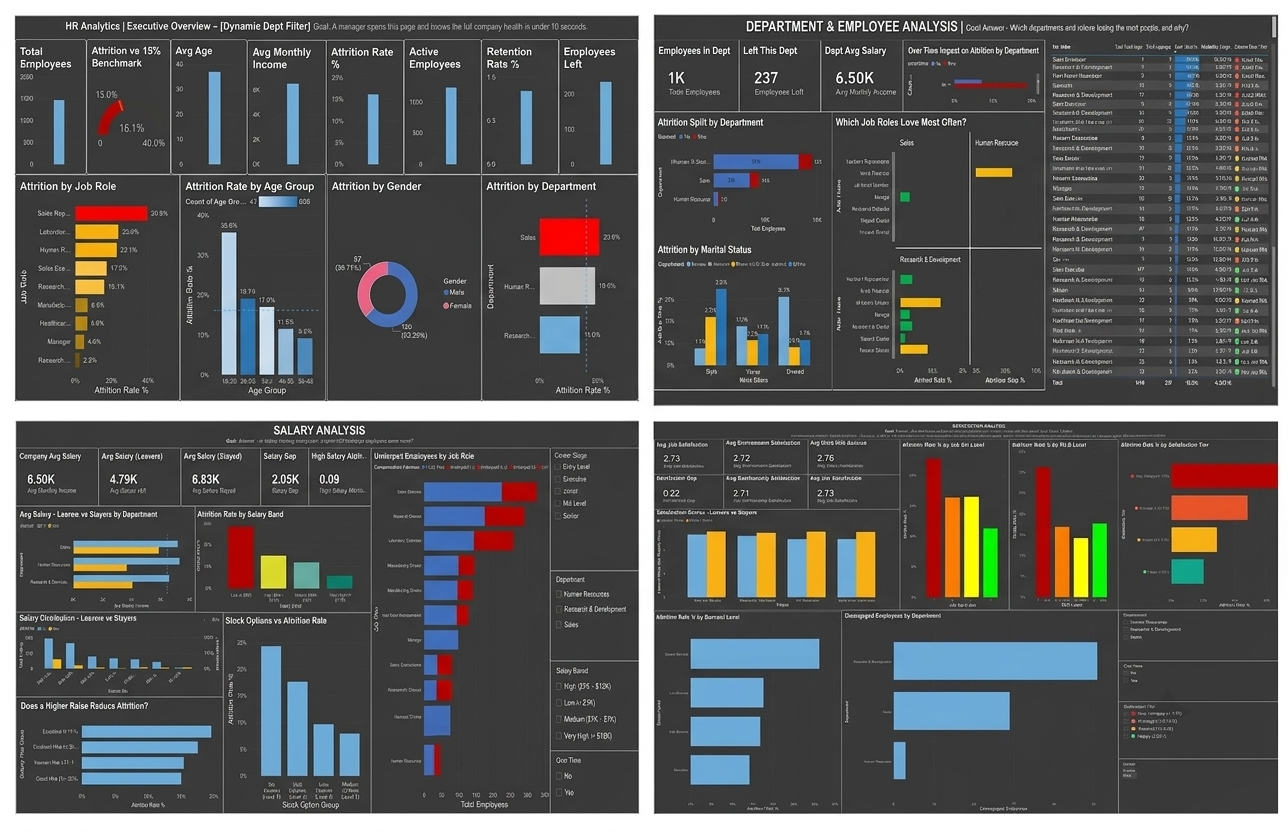
A Power BI HR Analytics Dashboard built on the IBM Employee Attrition dataset. The project uses Power Query, DAX, Tabular Editor, and DAX Studio to analyze employee turnover, salary impact, overtime, satisfaction, and attrition risk across 1,470 employees through four interactive dashboard pages.
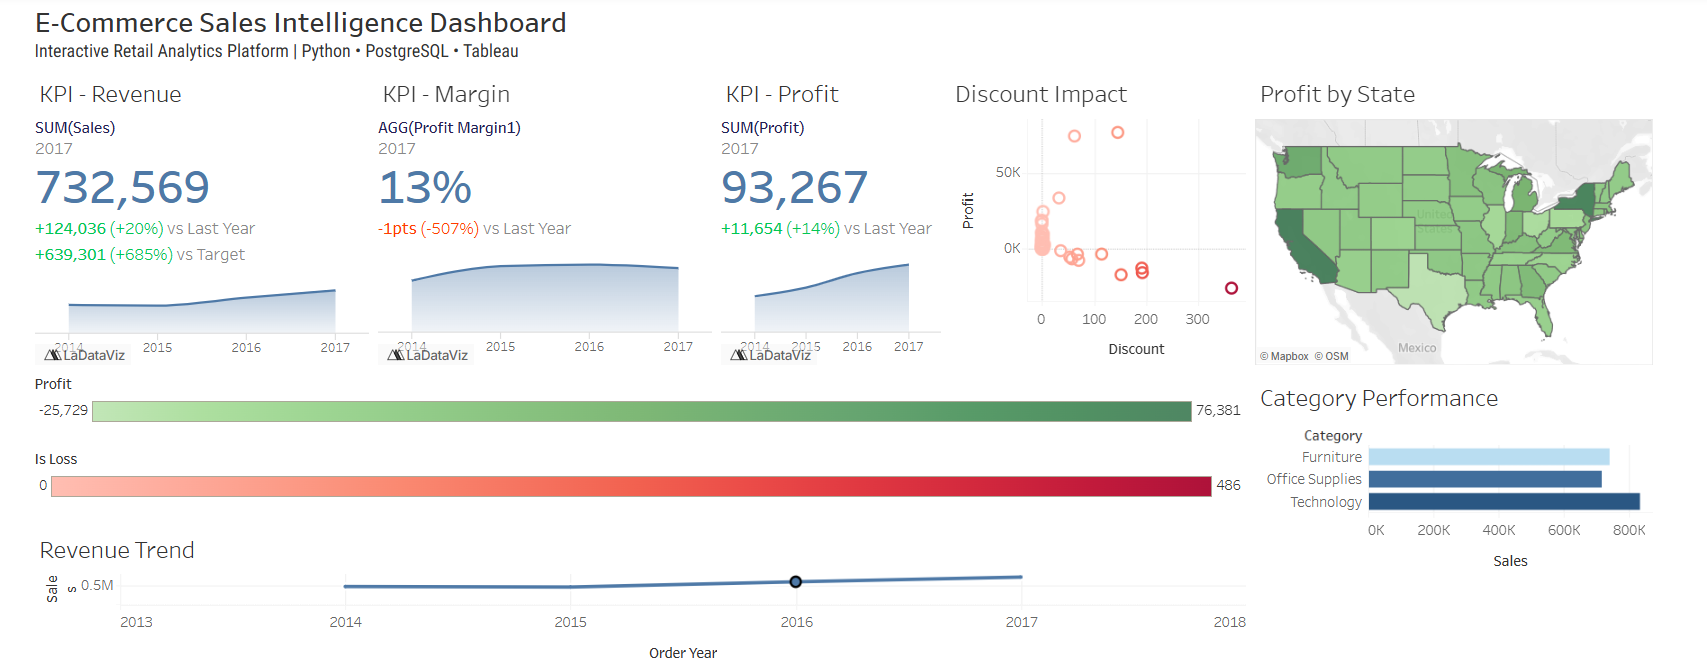
Built an end-to-end retail analytics pipeline using Python, PostgreSQL, SQL, and machine learning to analyze 9,994 sales transactions. Developed automated data cleaning, advanced analytics, forecasting models, and interactive dashboards (Tableau, Power BI, Plotly, Streamlit), generating actionable business insights and recommendations that identified opportunities to improve profitability by up to 68%.
I'm always open to new opportunities and interesting projects.
Feel free to reach out!